Supplementary MaterialThe paper by Browne, Dryden, Handley, Mian and Schadendorf (2010) considers the analysis of a dataset of mass spectra obtained from 101 Stage I and 104 Stage IV melanoma patients. The full dataset is available as a .csv file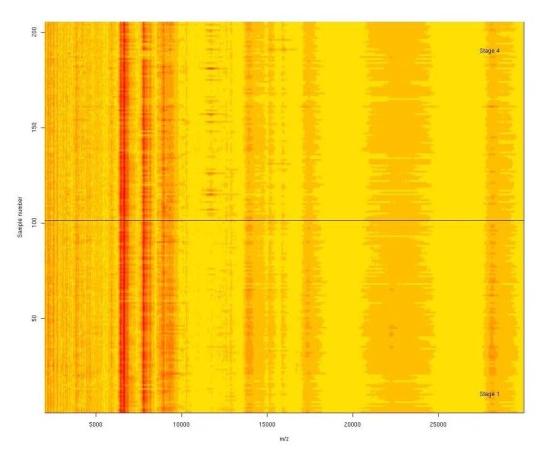 with the first 101 spectra Stage I and the last 104 spectra
Stage IV. A README file gives further details of the data.
with the first 101 spectra Stage I and the last 104 spectra
Stage IV. A README file gives further details of the data.
Supplementary plotsPlots as in Figure 2 of the paper are available for each section of the data.| Section 1 | Section 2 | Section 3 | Section 4 | Section 5 | Section 6 | Section 7 | Section 8 | Section 9 | Section 10 | Peak plotsPlots of the data at each peak are given here. The black is Stage I and the red is Stage IV.Density plotsPlots of the kernel densities of intensity at each peak are given here. The black is Stage I and the red is Stage IV.QQ plotsPlots of the normal probability plots of intensity at each peak are given here. The first plot is Stage I and the second plot is Stage IV, for each peak.R programThe R program for the main analysis.ZIP archiveA zip archive of the files.Top 500 peaksFrom the deterministic peak fitting algorithm in the paper the top 500 peaks (in the order of fitting/importance) are in mass-spec500peaks.csv . The columns are: Stage number, followed by the 500 peaks in the order fitted. The columns are labelled by m/z value. The rows are the 205 patients.NB. The fitted models in the paper by Browne et al. (2010) used the first 200 of these peaks. |